Figure 1
This work was conducted by someone occasionally called Robert during the last few years in order to satisfy the fans' desire for information regarding deeply moving developments within the DW series, concerning topics like length of the books, and numbers paragraphs and footnotes. You should not ask annoying questions like "why would anybody sit down and count all these words" but just appreciate this hitherto hidden statistical view on Terry's work.
You are free to use the enclosed information for non-commercial purposes, as long as you give this L-space net-page as reference. In scientific works I'd like to be properly cited (vanity, I assume and ask for your pardon). If you wish to use this information for commercial purposes you need to ask permission first.
If you want to contact me, you can do so via email: Robert Neumann.
By The Way, many thanks to Nathaniel.
Enjoy!
As far as I know, Terry Pratchett has not published any book, apart from "Theatre of Cruelty", in electronic form. This work of statistics does not mean in any way that I possess illegal electronic copies of the DW series or other writing of Pterry. Hence, don't ask me for a copy.
If you don't like all this reading, just look at the pictures. They are pretty self-explaining.
This work covers some statistical aspects on Pterry's DW books up to and including TOT and TAMAHER but excluding TLH.
Accuracy: I did my very best to get the correct numbers. However, you cannot rely on this information (that is, you are free to recount :-) to be more accurate than 1 in 1000 for the greater numbers, 1 in 100 for smaller ones and even small numbers may be off by one or two.
What was counted: The numbers are valid for the whole book except the title but including subtitle (as in TCOM, Pyramids or SM). Author's notes and dedications are not considered part of a book (count them for yourself), but the intro in L&L is. Everything else should be (i.e. is considered by me to be :-) fairly obvious.
Graphics: The short stories and novels were counted but not represented in the graphics, because they distort the picture and make it harder to see any trends. They are not really part of any development in length etc. anyway. Not represented are: the short stories Troll Bridge, Theatre of Cruelty and The Sea and Little Fishes, and the short novels (novelettes?) Eric and The Amazing Maurice and His Educated Rodents.
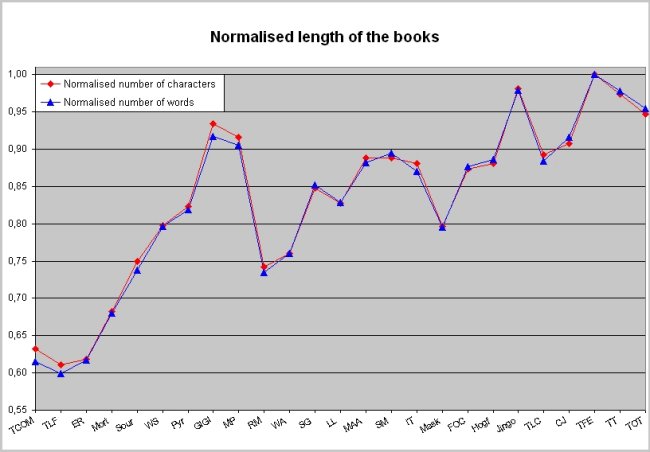
The graphics use normalised numbers, i.e. the actual number was divided by the biggest (or in some cases the smallest) number, resulting in numbers between 0 and 1. If you prefer, multiply them with 100 to obtain percentages. By doing this I was able to fit comparable items, like length in terms of number of characters and length in terms of number of words, in the same diagram although the absolute numbers are quite different.
Finally: Even though I restrained myself and did not add too much interpretation, never forget that you should only very hesitantly trust a statistic that you didn't manipulate yourself!
Due to all those different editions (hardcover, old Corgi, new Corgi, American and Australian ones etc.) it is not possible to compare numbers of pages or lines (I can't afford to buy 'em all in the new Corgi format just to count lines :-). Instead the (hopefully) constant numbers of words and characters [*] were used.
Figure 1
The numbers not counting blanks are :
(highest ones high-lightened)
1 |
TCOM |
TLF |
TB |
ER |
Mort |
Sour |
WS |
Pyr |
G!G! |
TOC |
|---|---|---|---|---|---|---|---|---|---|---|
2 |
307274 |
297129 |
14286 |
300400 |
331785 |
364272 |
387908 |
399963 |
453879 |
5484 |
3 |
0.63 |
0.61 |
0.03 |
0.62 |
0.68 |
0.75 |
0.80 |
0.82 |
0.93 |
0.01 |
4 |
66014 |
64371 |
3242 |
66260 |
73018 |
79222 |
85583 |
87931 |
98530 |
1243 |
5 |
0.61 |
0.60 |
0.03 |
0.62 |
0.68 |
0.74 |
0.80 |
0.82 |
0.92 |
0.01 |
1 |
Eric |
MP |
RM |
WA |
SG |
LL |
MAA |
SM |
IT |
Mask |
|---|---|---|---|---|---|---|---|---|---|---|
2 |
160925 |
445217 |
360560 |
369779 |
411903 |
402190 |
431711 |
431580 |
428415 |
387411 |
3 |
0.33 |
0.92 |
0.74 |
0.76 |
0.85 |
0.83 |
0.89 |
0.89 |
0.88 |
0.80 |
4 |
34924 |
97288 |
78933 |
81614 |
91543 |
89017 |
94726 |
96139 |
93473 |
85391 |
5 |
0.33 |
0.91 |
0.73 |
0.76 |
0.85 |
0.83 |
0.88 |
0.90 |
0.87 |
0.80 |
1 | TSALF |
FOC |
Hogf |
Jingo |
CJ |
TLC |
TFE |
TT |
TOT |
TAMA |
|---|---|---|---|---|---|---|---|---|---|---|
2 | 61238 |
424453 |
428310 |
476792 |
441270 |
433707 |
486097 |
473408 |
460096 |
283276 |
3 | 0.13 |
0.87 |
0.88 |
0.98 |
0.91 |
0.89 |
1.00 |
0.97 |
0.95 |
0.58 |
4 | 13514 |
94164 |
95180 |
105197 |
98407 |
94902 |
107406 |
105088 |
102477 |
63779 |
5 | 0.13 |
0.88 |
0.89 |
0.98 |
0.92 |
0.88 |
1.00 |
0.98 |
0.95 |
0.59 |
Surprisingly (to me at least) there is no more or less steady climb in the length. Rather, the 7ath novel, G!G! is among the longest, almost followed by one of the shortest (the 10th, RM, is as short as the 5th, Sourcery), and not surpassed before book no. 24, TFE!).
The two lines should match exactly. That they don't is caused by the average length of word varying between 4.48 (CJ) and 4.65 (TCOM) characters per word, a difference of almost 4%. The short stories TB and TOC show far lower values still!)! Obviously, Terry's language changes from book to book. Someone looking for a thesis could give it a look...
Figure 2
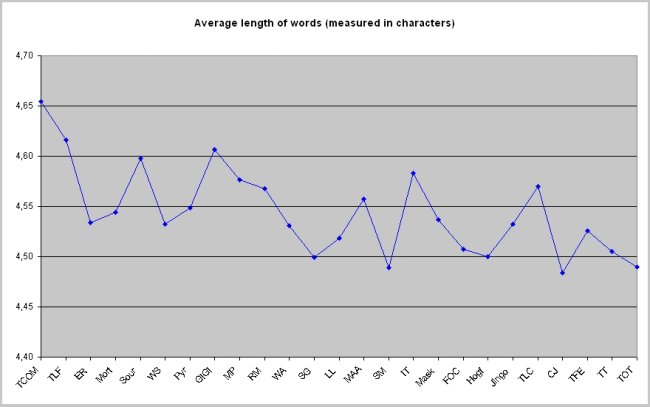
Anyway, the numbers upon which fig. 2 is based are:
1 |
TCOM |
TLF |
TB |
ER |
Mort |
Sour |
WS |
Pyr |
G!G! |
TOC |
|---|---|---|---|---|---|---|---|---|---|---|
2 |
4.65 |
4.62 |
4.41 |
4.53 |
4.54 |
4.60 |
4.53 |
4.55 |
4.61 |
4.41 |
3 |
1.00 |
0.99 |
0.95 |
0.97 |
0.98 |
0.99 |
0.97 |
0.98 |
0.99 |
0.95 |
1 |
Eric |
MP |
RM |
WA |
SG |
LL |
MAA |
SM |
IT |
Mask |
|---|---|---|---|---|---|---|---|---|---|---|
2 |
4.61 |
4.58 |
4.57 |
4.53 |
4.50 |
4.52 |
4.56 |
4.49 |
4.58 |
4.54 |
3 |
0.99 |
0.98 |
0.98 |
0.97 |
0.97 |
0.97 |
0.98 |
0.96 |
0.98 |
0.97 |
1 | TSALF |
FOC |
Hogf |
Jingo |
CJ |
TLC |
TFE |
TT |
TOT |
TAMA |
|---|---|---|---|---|---|---|---|---|---|---|
2 | 4.53 |
4.51 |
4.50 |
4.53 |
4.48 |
4.57 |
4.53 |
4.50 |
4.49 |
4.44 |
3 | 0.97 |
0.97 |
0.97 |
0.97 |
0.96 |
0.98 |
0.97 |
0.97 |
0.96 |
0.95 |
[*] This will present a problem should I ever do Good Omens, as there actually is a difference in length between the English and the American edition (see one of the last annotations for that book). As I don't know of other changes for the American market, nothing else is taken into account.
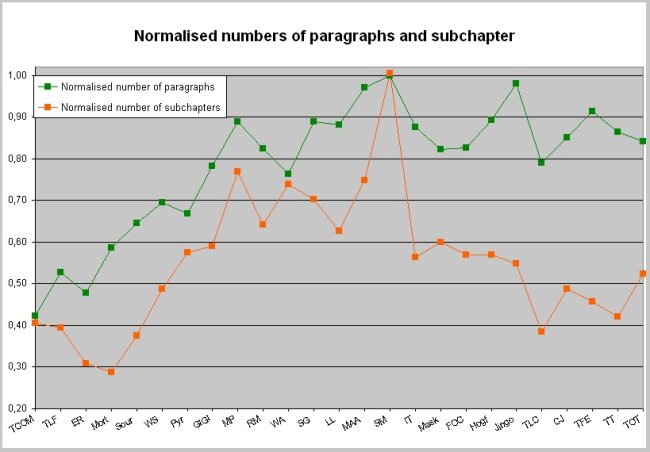
A sub-chapter is the text body between two empty lines (sometimes filled with one or three asterisks "*"). When you look at TAMAHER (or the non-DW books), where there are true chapters that are still segmented further, the labelling becomes more obvious.
Admittedly, the number of paragraphs belongs to the length of the books (fig. 1) rather than here, but if I include it in fig. 1 it gets all messed up while fig. 3 is rather empty.
Figure 3
Numbers are:
1 |
TCOM |
TLF |
TB |
ER |
Mort |
Sour |
WS |
Pyr |
G!G! |
TOC |
|---|---|---|---|---|---|---|---|---|---|---|
2 |
79 |
77 |
4 |
60 |
56 |
73 |
95 |
112 |
115 |
4 |
3 |
0.41 |
0.39 |
0.02 |
0.31 |
0.29 |
0.37 |
0.49 |
0.57 |
0.59 |
0.02 |
4 |
2558 |
3185 |
190 |
2884 |
3538 |
3894 |
4198 |
4042 |
4732 |
64 |
5 |
0.42 |
0.53 |
0.03 |
0.48 |
0.59 |
0.64 |
0.69 |
0.67 |
0.78 |
0.01 |
1 |
Eric |
MP |
RM |
WA |
SG |
LL |
MAA |
SM |
IT |
Mask |
|---|---|---|---|---|---|---|---|---|---|---|
2 |
58 |
150 |
125 |
144 |
137 |
122 |
146 |
196 |
110 |
117 |
3 |
0.30 |
0.77 |
0.64 |
0.74 |
0.70 |
0.63 |
0.75 |
1.00 |
0.56 |
0.60 |
4 |
1738 |
5372 |
4982 |
4610 |
5377 |
5331 |
5866 |
6044 |
5291 |
4964 |
5 |
0.29 |
0.89 |
0.82 |
0.76 |
0.89 |
0.88 |
0.97 |
1.00 |
0.88 |
0.82 |
1 | TSALF |
FOC |
Hogf |
Jingo |
CJ |
TLC |
TFE |
TT |
TOT |
TAMA |
|---|---|---|---|---|---|---|---|---|---|---|
2 | 14 |
111 |
111 |
107 |
95 |
75 |
89 |
82 |
102 |
49 |
3 | 0.07 |
0.57 |
0.57 |
0.55 |
0.49 |
0.38 |
0.46 |
0.42 |
0.52 |
0.25 |
4 | 715 |
4996 |
5400 |
5922 |
5144 |
4773 |
5519 |
5217 |
5088 |
2885 |
5 | 0.12 |
0.83 |
0.89 |
0.98 |
0.85 |
0.79 |
0.91 |
0.86 |
0.84 |
0.48 |
The number of paragraphs rises steadily till MP (no. 10) and then more or less stays constant.
The number of sub-chapters on the other hand reaches an all-time high (by more than 20 %) at the 16th novel (SM) and than quickly falls down again.
As we know there are no chapters in the DW books, except for TCOM and Pyramids, and lately TAMAHER. Not even I am willing to do statistics on a sample of three, so I regarded the chapters as sub-chapters for the purpose of fig. 2.
The number of paragraphs and sub-chapters can be expected to rise along with the length of the book. So here we see these numbers divided by the number of characters, thus giving the relative length of the paragraphs and sub-chapters on average [*]:
Figure 4
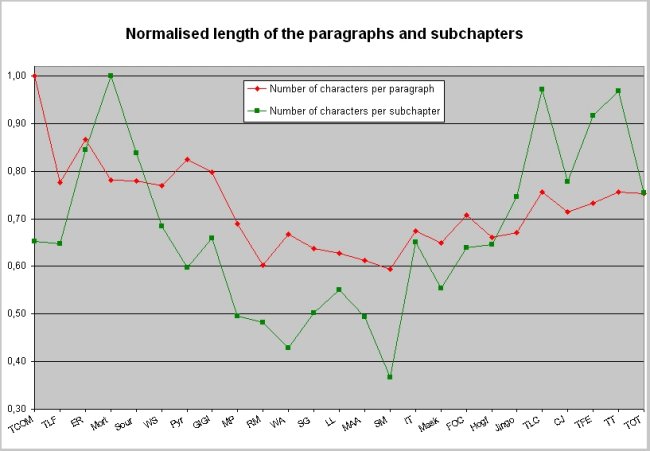
We see that the length of paragraphs quite continually falls till SM and then slowly but steadily rises again.
The relative length of the sub-chapters varies far more with a maximum in Mort but almost reaching that level again in the latest novels.
Numbers are:
1 |
TCOM |
TLF |
TB |
ER |
Mort |
Sour |
WS |
Pyr |
G!G! |
TOC |
|---|---|---|---|---|---|---|---|---|---|---|
2 |
3939 |
3910 |
4762 |
5092 |
6032 |
5059 |
4127 |
3603 |
3981 |
1828 |
3 |
0.65 |
0.65 |
0.79 |
0.84 |
1.00 |
0.84 |
0.68 |
0.60 |
0.66 |
0.30 |
4 |
120 |
93 |
75 |
104 |
94 |
94 |
92 |
99 |
96 |
86 |
5 |
1.00 |
0.78 |
0.63 |
0.87 |
0.78 |
0.78 |
0.77 |
0.82 |
0.80 |
0.71 |
1 |
Eric |
MP |
RM |
WA |
SG |
LL |
MAA |
SM |
IT |
Mask |
|---|---|---|---|---|---|---|---|---|---|---|
2 |
2823 |
2988 |
2908 |
2586 |
3029 |
3324 |
2977 |
2213 |
3930 |
3340 |
3 |
0.47 |
0.50 |
0.48 |
0.43 |
0.50 |
0.55 |
0.49 |
0.37 |
0.65 |
0.55 |
4 |
93 |
83 |
72 |
80 |
77 |
75 |
74 |
71 |
81 |
78 |
5 |
0.77 |
0.69 |
0.60 |
0.67 |
0.64 |
0.63 |
0.61 |
0.59 |
0.67 |
0.65 |
1 |
TSALF |
FOC |
Hogf |
Jingo |
CJ |
TLC |
TFE |
TT |
TOT |
TAMA |
|---|---|---|---|---|---|---|---|---|---|---|
2 |
4711 |
3859 |
3894 |
4498 |
4694 |
5861 |
5524 |
5845 |
4555 |
5902 |
3 |
0.78 |
0.64 |
0.65 |
0.75 |
0.78 |
0.97 |
0.92 |
0.97 |
0.76 |
0.98 |
4 |
86 |
85 |
79 |
81 |
86 |
91 |
88 |
91 |
90 |
98 |
5 |
0.71 |
0.71 |
0.66 |
0.67 |
0.71 |
0.76 |
0.73 |
0.76 |
0.75 |
0.82 |
[*] Technically you could divide the number of paragraphs and sub-chapters by the number of words, too, because, as we have seen in fig 1, it is not exactly proportional to the number of characters. However, the difference is too small as to make any difference, so to speak.
Everybody likes them. The one-liner, the two-liner, the longer explanations... Always good for a laugh or a smile, a chuckle or even what the ardent fans call a ROTFLKAS [*]. I love them.
Reason enough to look for a development in the footnotes. Are they getting more, or less, or staying constant? I put some effort into researching this on a statistical basis.
To cut it short: I can show you nothing. For whatever I looked, the picture is always the same: No development, no trend, no correlation. It is presented below, since I had done it. But the worth is dubious, you may as well skip this section. Quite depressing for one who set out to discover hidden wonders in the world of numbers. Anytime soon now I will go looking for a real life (in addition to the one I am leading already :-).
[*] Roll on the floor laughing, kicking and screaming.
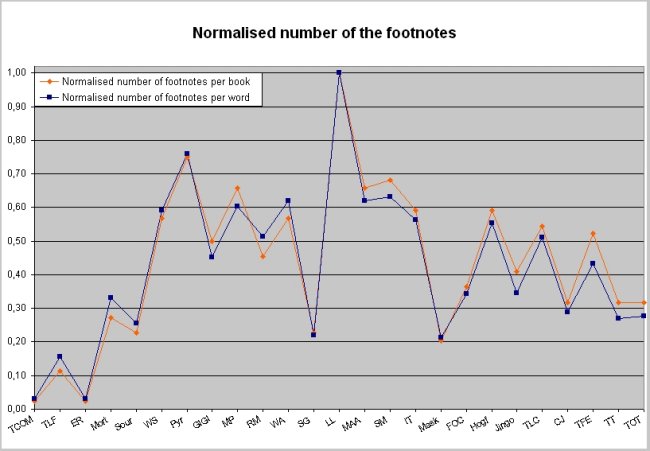
The first attempt to detect an ordering development in the footnotes was to research how many of them there are. But the number of footnotes varies quite erratically. Little is gained if we take the length of the books into account (i.e. divide the number of footnotes by the length of books measured in number of characters [*]):
Figure 5
Numbers are:
1 |
TCOM |
TLF |
TB |
ER |
Mort |
Sour |
WS |
Pyr |
G!G! |
TOC |
|---|---|---|---|---|---|---|---|---|---|---|
2 |
1 |
5 |
1 |
1 |
12 |
25 |
24 |
33 |
24 |
1 |
3 |
0.02 |
0.11 |
0.02 |
0.02 |
0.27 |
0.57 |
0.55 |
0.75 |
0.55 |
0.02 |
4 |
1.51 |
7.77 |
30.85 |
1.51 |
16.43 |
31.56 |
28.04 |
37.53 |
24.36 |
80.45 |
5 |
0.03 |
0.16 |
0.62 |
0.03 |
0.33 |
0.64 |
0.57 |
0.76 |
0.49 |
1.63 |
1 |
Eric |
MP |
RM |
WA |
SG |
LL |
MAA |
SM |
IT |
Mask |
|---|---|---|---|---|---|---|---|---|---|---|
2 |
13 |
29 |
19 |
24 |
10 |
44 |
24 |
30 |
25 |
9 |
3 |
0.30 |
0.66 |
0.43 |
0.55 |
0.23 |
1.00 |
0.55 |
0.68 |
0.57 |
0.20 |
4 |
37.22 |
29.81 |
24.07 |
29.41 |
10.92 |
49.43 |
25.34 |
31.20 |
26.75 |
10.54 |
5 |
0.75 |
0.60 |
0.49 |
0.59 |
0.22 |
1.00 |
0.51 |
0.63 |
0.54 |
0.21 |
1 |
TSALF |
FOC |
Hogf |
Jingo |
CJ |
TLC |
TFE |
TT |
TOT |
TAMA |
|---|---|---|---|---|---|---|---|---|---|---|
2 |
0 |
16 |
26 |
18 |
14 |
24 |
21 |
14 |
15 |
4 |
3 |
0.00 |
0.36 |
0.59 |
0.41 |
0.32 |
0.55 |
0.48 |
0.32 |
0.34 |
0.09 |
4 |
0.00 |
16.99 |
27.32 |
17.11 |
14.23 |
25.29 |
19.55 |
13.32 |
14.64 |
6.27 |
5 |
0.00 |
0.34 |
0.55 |
0.35 |
0.29 |
0.51 |
0.40 |
0.27 |
0.30 |
0.13 |
The number of footnotes per word closely matches the number of footnotes per book, so this again provides no clue for any change in the master's mind. (May I suggest a thesis looking into possible differences in the number of footnotes in the "lighter" and more serious novels?)
A statistical trapdoor is TOC: it contains one footnote, but because it is so short it has the highest number of footnotes per word by far (for the normalisation he value for L&L was used).
Row 5 of the tables can be translated into "How many words there are in-between two footnotes", for your interest this is given below (obtained by dividing the number of words by the number of footnotes):
1 |
TCOM |
TLF |
TB |
ER |
Mort |
Sour |
WS |
Pyr |
G!G! |
TOC |
|---|---|---|---|---|---|---|---|---|---|---|
2 |
66014 |
12874 |
- |
66260 |
6085 |
7922 |
3423 |
2665 |
4479 |
1243 |
1 |
Eric |
MP |
RM |
WA |
SG |
LL |
MAA |
SM |
IT |
Mask |
|---|---|---|---|---|---|---|---|---|---|---|
2 |
2910 |
3355 |
3947 |
3265 |
9154 |
2023 |
3266 |
3205 |
3595 |
9488 |
1 |
TSALF |
FOC |
Hogf |
Jingo |
CJ |
TLC |
TFE |
TT |
TOT |
TAMA |
|---|---|---|---|---|---|---|---|---|---|---|
2 |
- |
5885 |
3661 |
5844 |
3954 |
7029 |
4670 |
7506 |
7320 |
15945 |
[*]See footnote for Relative length of the paragraphs and sub-chapters[*]
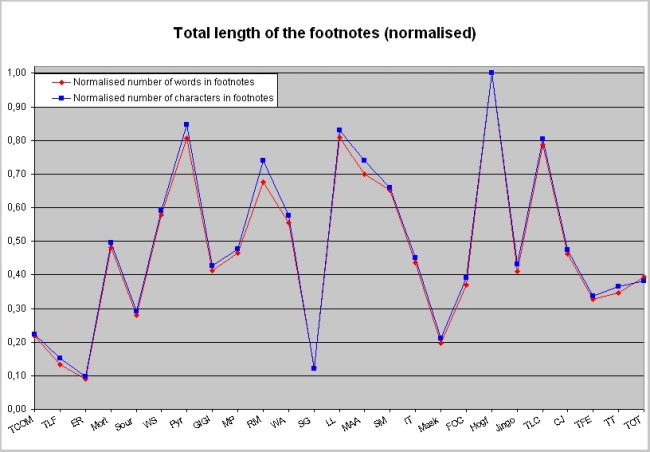
OK, I thought, let's see if the picture changes, if I consider the total number of words and characters in the footnotes. Maybe changes in the length balance for changes in numbers... But, alas, nothing balances, see for yourself:
Figure 6
Numbers are:
1 |
TCOM |
TLF |
TB |
ER |
Mort |
Sour |
WS |
Pyr |
G!G! |
TOC |
|---|---|---|---|---|---|---|---|---|---|---|
2 |
364 |
223 |
0 |
151 |
801 |
466 |
964 |
1345 |
688 |
18 |
3 |
0.22 |
0.13 |
0.00 |
0.09 |
0.48 |
0.28 |
0.58 |
0.81 |
0.41 |
0.01 |
4 |
1677 |
1140 |
0 |
734 |
3714 |
2186 |
4419 |
6342 |
3202 |
71 |
5 |
0.22 |
0.15 |
0.00 |
0.10 |
0.50 |
0.29 |
0.59 |
0.85 |
0.43 |
0.01 |
1 |
Eric |
MP |
RM |
WA |
SG |
LL |
MAA |
SM |
IT |
Mask |
|---|---|---|---|---|---|---|---|---|---|---|
2 |
663 |
777 |
1128 |
925 |
207 |
1348 |
1165 |
1087 |
726 |
330 |
3 |
0.40 |
0.47 |
0.68 |
0.55 |
0.12 |
0.81 |
0.70 |
0.65 |
0.44 |
0.20 |
4 |
3189 |
3580 |
5546 |
4312 |
898 |
6214 |
5551 |
4940 |
3377 |
1575 |
5 |
0.43 |
0.48 |
0.74 |
0.58 |
0.12 |
0.83 |
0.74 |
0.66 |
0.45 |
0.21 |
1 |
TSALF |
FOC |
Hogf |
Jingo |
CJ |
TLC |
TFE |
TT |
TOT |
TAMA |
|---|---|---|---|---|---|---|---|---|---|---|
2 |
0 |
615 |
1667 |
684 |
1312 |
770 |
547 |
577 |
657 |
155 |
3 |
0.00 |
0.37 |
1.00 |
0.41 |
0.79 |
0.46 |
0.33 |
0.35 |
0.39 |
0.09 |
4 |
0 |
2939 |
7492 |
3234 |
6023 |
3555 |
2525 |
2733 |
2864 |
641 |
5 |
0.00 |
0.39 |
1.00 |
0.43 |
0.80 |
0.47 |
0.34 |
0.36 |
0.38 |
0.09 |
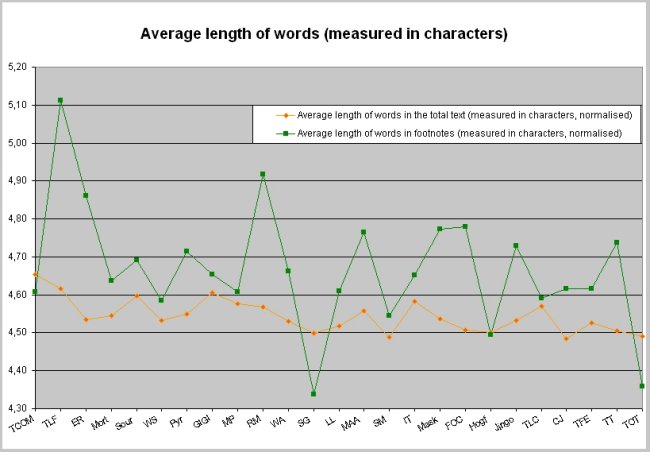
The difference in the length of footnotes measured in words and characters is again [*] due to the differences in the length of the words. The differences are greater than for the total text (that is probably due to the smaller sample, but offers, of course, a wide field of interpretation :-), and generally, but not always, the word used in footnotes are longer then the ones used in the total text.
Figure 7
Numbers are:
1 |
TCOM |
TLF |
TB |
ER |
Mort |
Sour |
WS |
Pyr |
G!G! |
TOC |
|---|---|---|---|---|---|---|---|---|---|---|
2 |
4.65 |
4.62 |
4.41 |
4.53 |
4.54 |
4.60 |
4.53 |
4.55 |
4.61 |
4.41 |
3 |
4.61 |
5.11 |
- |
4.86 |
4.64 |
4.69 |
4.58 |
4.72 |
4.65 |
3.94 |
4 |
0.91 |
0.90 |
0.86 |
0.89 |
0.89 |
0.90 |
0.89 |
0.89 |
0.90 |
0.86 |
5 |
0.90 |
1.00 |
- |
0.95 |
0.91 |
0.92 |
0.90 |
0.92 |
0.91 |
0.77 |
1 |
Eric |
MP |
RM |
WA |
SG |
LL |
MAA |
SM |
IT |
Mask |
|---|---|---|---|---|---|---|---|---|---|---|
2 |
4.61 |
4.58 |
4.57 |
4.53 |
4.50 |
4.52 |
4.56 |
4.49 |
4.58 |
4.54 |
3 |
4.81 |
4.61 |
4.92 |
4.66 |
4.34 |
4.61 |
4.76 |
4.54 |
4.65 |
4.77 |
4 |
0.90 |
0.90 |
0.89 |
0.89 |
0.88 |
0.88 |
0.89 |
0.88 |
0.90 |
0.89 |
5 |
0.94 |
0.90 |
0.96 |
0.91 |
0.85 |
0.90 |
0.93 |
0.89 |
0.91 |
0.93 |
1 |
TSALF |
FOC |
Hogf |
Jingo |
CJ |
TLC |
TFE |
TT |
TOT |
TAMA |
|---|---|---|---|---|---|---|---|---|---|---|
2 |
4.53 |
4.51 |
4.50 |
4.53 |
4.57 |
4.48 |
4.53 |
4.50 |
4.49 |
4.44 |
3 |
- |
4.78 |
4.49 |
4.73 |
4.59 |
4.62 |
4.62 |
4.74 |
4.36 |
4.14 |
4 |
0.89 |
0.88 |
0.88 |
0.89 |
0.89 |
0.88 |
0.89 |
0.88 |
0.88 |
0.87 |
5 |
- |
0.93 |
0.88 |
0.92 |
0.90 |
0.90 |
0.90 |
0.93 |
0.85 |
0.81 |
[*] Cf. fig 2 and it's description
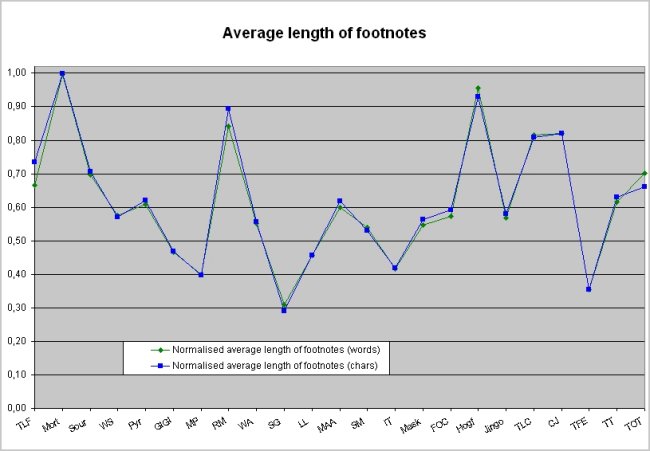
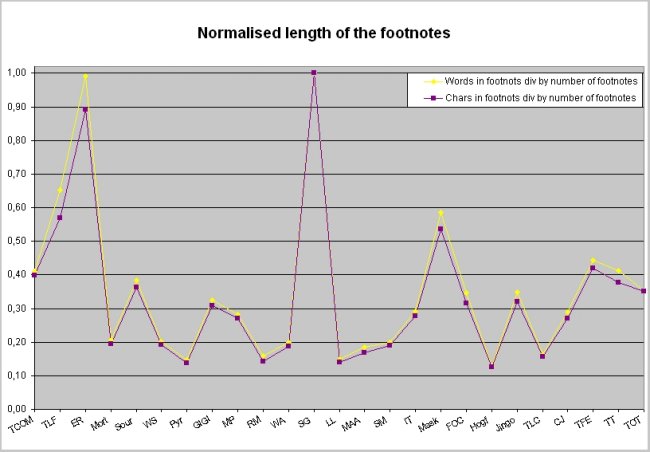
While we are about it, let's see if there is a development in the length of the footnotes, even if it does not cancel out the development in their number. Let's see, if they tend to get one-liners, or long explanations of some Discworld detail or other.
Well, it is not the case. Firstly I had to leave out TCOM and ER for the graphics, because their only one but long footnote (you can see it in the table: Their footnote is 5.5 respective 2.4 times longer then the next-highest average) just distort the picture. Secondly, the highest averages (Mort, RM and Hogfather) are about three times higher than the shortest (SG and TFE). Thirdly, not a trace of a trend is recognisable.
Figure 8
Numbers are:
1 |
TCOM |
TLF |
TB |
ER |
Mort |
Sour |
WS |
Pyr |
G!G! |
TOC |
|---|---|---|---|---|---|---|---|---|---|---|
2 |
364 |
45 |
0 |
151 |
67 |
47 |
39 |
41 |
31 |
18 |
3 |
5.43 |
0.67 |
0.00 |
2.25 |
1.00 |
0.70 |
0.58 |
0.61 |
0.47 |
0.27 |
4 |
1677 |
228 |
0 |
734 |
310 |
219 |
177 |
192 |
146 |
71 |
5 |
5.41 |
0.74 |
0.00 |
2.37 |
1.00 |
0.71 |
0.57 |
0.62 |
0.47 |
0.23 |
1 |
Eric |
MP |
RM |
WA |
SG |
LL |
MAA |
SM |
IT |
Mask |
|---|---|---|---|---|---|---|---|---|---|---|
2 |
55 |
27 |
56 |
37 |
21 |
31 |
40 |
36 |
28 |
37 |
3 |
0.82 |
0.40 |
0.84 |
0.55 |
0.31 |
0.46 |
0.60 |
0.54 |
0.42 |
0.55 |
4 |
266 |
123 |
277 |
172 |
90 |
141 |
191 |
165 |
130 |
175 |
5 |
0.86 |
0.40 |
0.89 |
0.56 |
0.29 |
0.46 |
0.62 |
0.53 |
0.42 |
0.56 |
1 |
TSALF |
FOC |
Hogf |
Jingo |
CJ |
TLC |
TFE |
TT |
TOT |
TAMA |
|---|---|---|---|---|---|---|---|---|---|---|
2 |
0 |
38 |
64 |
38 |
55 |
55 |
24 |
41 |
47 |
39 |
3 |
0.00 |
0.57 |
0.96 |
0.57 |
0.82 |
0.82 |
0.35 |
0.62 |
0.70 |
0.58 |
4 |
0 |
184 |
288 |
180 |
251 |
254 |
110 |
195 |
205 |
160 |
5 |
0.00 |
0.59 |
0.93 |
0.58 |
0.81 |
0.82 |
0.35 |
0.63 |
0.66 |
0.52 |
My last attempt to obtain insight in the footnote-topic was: to see if there is something less erratically to observe if I divide the number of words/characters in the total text by the number of words/characters in the footnotes only. I.e. how many times is the book (total text) longer than the footnotes.
Here at last there is at least something to be observed. The highest values by far show ER and SG, followed (if separated by a factor of two) by Maskerade. On the other end of the value-spectrum, there are ten books showing values between 0.1 and 0.2.
I leave the interpretation to you, just bear in mind that a high value equals a high text-to-footnote-ratio, i.e. few footnotes.
Figure 9
Numbers are:
1 |
TCOM |
TLF |
TB |
ER |
Mort |
Sour |
WS |
Pyr |
G!G! |
TOC |
|---|---|---|---|---|---|---|---|---|---|---|
2 |
181 |
289 |
0 |
439 |
91 |
170 |
89 |
65 |
143 |
69 |
3 |
0.41 |
0.65 |
0.00 |
0.99 |
0.21 |
0.38 |
0.20 |
0.15 |
0.32 |
0.16 |
4 |
183 |
261 |
0 |
409 |
89 |
167 |
88 |
63 |
142 |
77 |
5 |
0.40 |
0.57 |
0.00 |
0.89 |
0.19 |
0.36 |
0.19 |
0.14 |
0.31 |
0.17 |
1 |
Eric |
MP |
RM |
WA |
SG |
LL |
MAA |
SM |
IT |
Mask |
|---|---|---|---|---|---|---|---|---|---|---|
2 |
53 |
125 |
70 |
88 |
442 |
66 |
81 |
88 |
129 |
259 |
3 |
0.12 |
0.28 |
0.16 |
0.20 |
1.00 |
0.15 |
0.18 |
0.20 |
0.29 |
0.59 |
4 |
50 |
124 |
65 |
86 |
459 |
65 |
78 |
87 |
127 |
246 |
5 |
0.11 |
0.27 |
0.14 |
0.19 |
1.00 |
0.14 |
0.17 |
0.19 |
0.28 |
0.54 |
1 |
TSALF |
FOC |
Hogf |
Jingo |
CJ |
TLC |
TFE |
TT |
TOT |
TAMA |
|---|---|---|---|---|---|---|---|---|---|---|
2 |
0 |
153 |
57 |
154 |
72 |
128 |
196 |
182 |
156 |
411 |
3 |
0.00 |
0.35 |
0.13 |
0.35 |
0.16 |
0.29 |
0.44 |
0.41 |
0.35 |
0.93 |
4 |
0 |
144 |
57 |
147 |
72 |
124 |
193 |
173 |
161 |
442 |
5 |
0.00 |
0.31 |
0.12 |
0.32 |
0.16 |
0.27 |
0.42 |
0.38 |
0.35 |
0.96 |
The L-Space Web is a creation
of The L-Space Librarians
This mirror
site is maintained by Colm Buckley